Where a request waits on its way to a worker
When request workers are on (workers.requestCount above 0), the process that
owns the listeners, the front process, does not answer most HTTP requests
itself. It hands each one to a worker thread
(Architecture describes the pools). This page follows one
request from the socket to the worker and back, names every place it can wait,
and explains the log line that measures each wait.
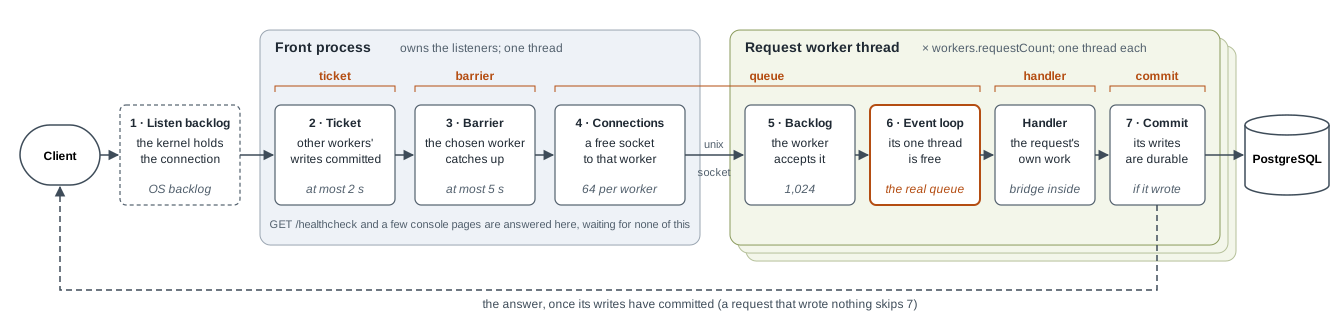
The path, in order
| # | Where it waits | What it is waiting for | What bounds it |
|---|---|---|---|
| 1 | The main port’s listen backlog | The front process’s event loop to accept the connection | The operating system’s backlog |
| 2 | The front process: ticket | Writes made by earlier requests through other workers to be announced as committed | 2 seconds, then the request is served without them |
| 3 | The front process: barrier | The chosen worker to catch up with those writes | 5 seconds |
| 4 | The front process: the worker’s connection pool | A free connection to that worker | workers.maxSockets connections per worker (default 64); requests past it wait their turn in the front process’s memory |
| 5 | The worker’s socket backlog | The worker to accept the connection | A backlog of 1,024 on the worker’s unix socket |
| 6 | The worker’s event loop | The worker’s one thread to be free of the requests before it | Nothing; this is the real queue |
| 7 | The worker: commit | The request’s own writes to commit to the database before the answer is sent | The database |
Stages 2 and 3 are the read-your-write wait; Read-your-write below says when a request has to do them. Stages 4 to 6 are reported together as queue. Stage 7 happens after the handler has run; a request that wrote nothing skips it.
Some paths never go to a worker. GET /healthcheck is answered by the front
process at once, so a liveness probe waits for none of the above. A few console
pages that read or change what only the front process holds are always
answered there too: listeners, the TLS trust store and connection, the
debugger, the SPIFFE brokers, the scheduler, the worker pools and node health.
Which worker
A request carrying a session cookie, the pool’s own pin cookie or a sign-in
flow in its address (authn, consent, device_code, SAMLart) goes to the
worker that served that key before, so one browser’s sign-in stays on one
worker. A request carrying none of them, such as a token request from a
client’s server, goes to the worker with the fewest requests in flight.
Bulk traffic has its own lane. Paths listed in workers.batch (by default
/scim and the two Shared Signals receivers) are sent only to a share of the
workers (workers.batchWorkerShare, default 50%), and only
workers.batchConcurrency of them (default 8) are in flight at once. The rest
wait in a list of at most workers.batchQueueLimit (default 5,000) for at most
workers.batchQueueTimeoutS (default 60 seconds). That way a bulk load cannot
fill every worker’s event loop, and sign-ins go on being answered beside it.
Read-your-write
Workers share nothing but the database, and a worker learns of another worker’s
writes within about half a second to a second. Without a wait, a browser could
sign in through one worker and be sent to another that has not yet heard of the
session. workers.readYourWrite decides what a request waits for:
| Value | A request waits for |
|---|---|
session (the default) |
The writes of earlier requests that carried the same session cookie, pin cookie or flow, every write of a request that carried none of them (a relying party’s server, an API caller, a dispatched LDAP operation), and the front process’s own writes. It does not wait for another browser’s writes. A code exchange at the token endpoint waits for its code’s writes, as below. Any other request carrying none of them waits as in global. |
global |
Every write any request made before it, through any worker. |
off |
Nothing. Use it only where every client is pinned to one worker. |
true means session and false means off.
In session mode the token endpoint’s code exchange has no session cookie,
because it comes from the client’s server rather than the browser. It waits
for its CODE instead. When the authorization endpoint redirects the browser
with code= in the query, the pool files that answer under the code, together
with whatever the browser’s session and sign-in had still outstanding. A
POST to the token endpoint with a form body of at most 16 KiB and a declared
length is read before it waits, and passed to the worker unchanged. If it is
an authorization_code grant for a code the pool learnt that way, it waits
only for those writes.
Everything else at the token endpoint waits as in global: a code the pool
did not learn (one delivered by form_post or in a fragment, or minted on
another node), the refresh grant, and a body that is larger, chunked or sent
over HTTP/2 without a length. stats().sessionBarrier.codeKeyed counts the
exchanges keyed by their code.
Reading the request phases log line
Once a minute each process logs, at info, its twelve busiest routes of the
last minute with the 50th and 95th percentile of each phase in milliseconds:
request phases, last 60 s: POST /oauth2/token 32.8/s — p50/p95 ms:
  ticket 0/1, barrier 70/308, queue 11/77, handler 93/256, commit 59/195,
  bridge 6/35, total 267/653
| Phase | Measured by | What it is |
|---|---|---|
ticket |
The front process | Stage 2 |
barrier |
The front process | Stage 3 |
queue |
The front process | Stages 4 to 6: the round trip to the worker less the worker’s handler and commit, so it also includes making the connection and carrying the answer back |
handler |
The worker | The request’s own work, from reaching the worker’s middleware to its answer being ready |
commit |
The worker | Stage 7 |
bridge |
The worker | Time inside handler that the worker’s thread was blocked in synchronous database reads. It is part of handler, not added to it. |
total |
The front process | From the request reaching the front process to the answer coming back from the worker |
A route is the method and the first two path segments, without a realm prefix
or a query. The route is not a request count: GET /oauth2/authorize appears
twice in one OpenID Connect sign-in.
Three more kinds of line describe writing to the database rather than a request, and appear in the process that does the writing:
| Line | What it measures |
|---|---|
FLUSH minted |
One write of minted state (sessions, codes, tokens): prepare (sealing the rows), db (the database’s time), rows, total |
FLUSH directory |
One write of directory changes: rows, total |
COMMIT through |
One response’s commit wait (stage 7), split into the directory, minted and keys writes it waited on. The parts run at the same time, so each is the time from the start of the wait until that part was done. The largest is the one that held the response, and they do not add up to total. A commit that failed is not counted. |
What to look at first
queuehigh at p50. The workers’ threads are busy. Look athandlerandbridgefor the routes that dominate, and at whether there are cores to spare for another worker (Monitoring → Worker Pools).queuelow at p50 and high at p95. Bursts are stacking behind slow requests on one worker. Password hashing and bulk imports are the usual causes;workers.batchkeeps a bulk load in its own lane.barrierortickethigh. Requests are waiting for other workers’ writes. Check thatworkers.readYourWriteissession. At the token endpoint, comparestats().sessionBarrier.codeKeyedwithglobal: a code exchange keyed by its code waits only for its code, and a refresh, an unknown code or a large body still waits as inglobal, as described above.commithigh. The database is slow to commit. CompareCOMMIT through’s parts with theFLUSHlines: a part much longer than its flush is waiting for an earlier write to finish first.- Raising
workers.maxSocketsis rarely the answer. It moves the wait from stage 4 to stage 6 without making the worker faster. Do not make it small either: the service makes requests to itself, and a worker whose connections are all held by requests waiting on such a call needs one more to make progress.
Related
- Architecture: the pools, and what runs where.
- Configuration: every
workers.*setting with its environment variable and default. - Persistence: what is written to the database, and when.
- Monitoring → Worker Pools (
/admin/worker-pools): each worker’s requests in flight and served, live.